GIS 101#
A geographic information system (GIS) is a key component to integrate data geospatially, i.e., linking data to their physical locations on Earth. GIS is one of the way in which you can access the metadata of your georeferenced 3D model easily. It is the system that forms the foundation to almost everything that is Svalbox. In other words, everyone should at the very least grasp the basics - hence the need for this section.
Data source
This page contains bits and pieces from all over the internet, supplemented by work by Peter Betlem and Nil Rodes. It’s only use is to help form a basic understanding of GIS.
Some useful definitions#
ESRI : Esri is an international supplier of geographic information system software, web GIS and geodatabase management applications. The company was founded as the Environmental Systems Research Institute in 1969 as a land-use consulting firm. Esri has tons of resources and online help for any kind of GIS questions.
ArcGIS : ArcGIS is a geographic information system (GIS) for working with maps and geographic information maintained by the Environmental Systems Research Institute (Esri). It is used for creating and using maps, compiling geographic data, analyzing mapped information, sharing and discovering geographic information, using maps and geographic information in a range of applications, and managing geographic information in a database.
ArcGIS Pro : A new, integrated GIS application, planned to eventually supersede ArcMap and its companion programs.
QGIS : QGIS is a free and open-source cross-platform desktop geographic information system application that supports viewing, editing, and analysis of geospatial data.
Layer : Layers are the mechanism used to display geographic datasets. Each layer references a dataset and specifies how that dataset is portrayed using symbols and text labels. When you add a layer to a map, you specify its dataset and set its map symbols and labeling properties. Each map, globe, or scene document in ArcGIS is assembled by adding a series of layers. Layers are displayed in a particular order displayed in the map’s table of contents. Layers listed at the bottom are displayed first, followed by the layers above them.
ShapeFile : A shapefile is an Esri vector data storage format for storing the location, shape, and attributes of geographic features. It is stored as a set of related files and contains one feature class. Shapefiles often contain large features with a lot of associated data and historically have been used in GIS desktop applications such as ArcMap. A shapefile consists of multiple components, containing at least the .shp, .shx, .dbf, and .prj files. A better option is to use the opensource GeoPackage equivalent.
GeoPackage : An open source storage format for storing the location, shape, and attributes of geographic features. May feature many different feature classes and files.
Feature Class : Feature classes are homogeneous collections of common features, each having the same spatial representation, such as points, lines, or polygons, and a common set of attribute columns, for example, a line feature class for representing road centerlines. The four most commonly used feature classes are points, lines, polygons, and annotation (the geodatabase name for map text).
Points : Features that are too small to represent as lines or polygons as well as point locations (such as GPS observations).
Lines : Represent the shape and location of geographic objects, such as street centerlines and streams, too narrow to depict as areas. Lines are also used to represent features that have length but no area, such as contour lines and boundaries.
Polygons : A set of many-sided area features that represents the shape and location of homogeneous feature types such as states, counties, parcels, soil types, and land-use zones.
Annotation : Map text including properties for how the text is rendered. For example, in addition to the text string of each annotation, other properties are included such as the shape points for placing the text, its font and point size, and other display properties. Annotation can also be feature linked and can contain subclasses.
Creation of a ArcGIS Pro project#
To create a new project in ArcGIS Pro, follow these steps:
New, Blank Templates, Map. Define the Name of the new project.
Tip
Ideally the name of the project won’t conatin any spaces, dots, or commas.
In Location, define the folder path where you want to save the project. This last step is important to have a good data structure because everything related to your project will be saved there. Also, select the tick that says Create a new folder for this project.
Specify a coordinate system for your project#
Note
A coordinate (or Spatial) reference systems (CRS) define specific map projections and the transformations that are needed between different systems. A CRS is always composed of a coordinate system and datum component. A coordinate system is a set of mathematical rules that specify how coordinates are to be assigned to points. A datum is a set of parameters that define the position of the origin, the scale, and the orientation of a coordinate system. Luckily, these are pre-defined by the European Petroleum Survey Group (EPSG) for the most common CRSs in use.
In ArcGIS Pro, we can define a vertical coordinate system for a map or scene. In the Table of Contents right click on the layer or map you want to modify > Properties > Coordinate system.
The coordinate System for Svalbard is: WGS1984 UTM Zone 33N. You can do a quick search by looking for the EPSG:32633.
Change Projected Coordinate System in a layer#
We differentiate two common cases for why you would like to change the projection of your layer:
Layer with a wrong projection
Create a new Feature Class > Geoprocessing > Create Feature Class > Only fill “Feature Class Name” > Run >> Geoprocessing > Define Projection Tool > Input Dataset of Feature Class: select the layer with the wrong projection system and Coordinate System: select the layer that has an unknown coordinate system > Run. The layer will match the coordinate characteristics of the project.
Layer with an Unknown Projection
Geoprocessing > Define Projection Tool > Input Dataset of Feature Class: Select the layer you want to change the projection system and Coordinate System: Select a layer that has already the projection you want > Run.
Adding data#
Importing data#
Map > Add data > Go to the folder where you saved the data you want to import. Once you add it, it will appear as a new layer in the Table of Contents.
Added the data but don’t know where it is? Here is some magic…
Click on View and “Catalog pane”.
The ArcGIS servers you have added are now visible on the catalog pane.
You can drag the data layers to your map.
Importing GPX tracks#
ArcGIS Pro uses a Georeferencing tool to import GPX tracks. Click on the Tools icon in the Analysis tab to open up the Geoprocessing panel. Then search for GPX to Features.
Fig. 11 Select the GPX file as Input to GPX File, give the Output Feature class a distinguishable name, and click RUN to add the GPS track to the map.#
Importing a digital terrain model#
Go to Map and click on the Add Data icon, selecting Data. Then browse to the folder where you have your DTM and select it. Once again, go to the Tools option in Analysis to open up the Geoprocessing toolbox. Set the imported DEM layer as the Input Raster, fill out targeted output and the measurements, and then click on Run to generate a slope.
Note
You can download all the information related to the Digital Terrain Models uploaded in Svalbox from the Zenodo database.
The files needed to plot the models in ArcGIS Pro are in the export.zip folder.
Fig. 12 Click on the DOI link of the model. A new tab will open linking to the Zenodo database, from where you can download all the data.#
Creating slopes, hillshades and contours#
Hillshade: Imagery > Raster Functions > Surface > Hillshade > Choose the layer you want to do the hillshade from > Define the vertical exaggeration > Create New Layer.
Contour: Imagery > Raster Functions > Surface > Contour > Choose the layer you want to do the contours from > Define the contour separation > Create New Layer.
You can do this with lots of other tools: Aspect, Slope, Shaded relief, Curvature, etc.
Adding new features#
Option 1 : Open Catalog > Right Click on the geodatabase file (.gdb) > New > Feature Class > Define a name and the type of feature you want to create. Once it is created, drag the new .gdb to the Table of Contents. Select the new layer > Edit > Create > Define the feature you want to work with.
Option 2 : Geoprocessing Pane > Search for Create Feature Class. Define all the parameters. The Name cannot contain Spaces, points, or commas. Make sure to select the Coordinate System of the Current Map. Through this step, the New Feature layer will automatically appear in the table of contents.
After adding the Feature Class, you may add additional fields to it, important to capture descriptions, dates and more all within the same point.
You can do so by right-clicking your newly created layer, and proceeding with the Attribute Table.
A newly created layer usually comes in empty, with just the OBJECTID and Shape columns created.
Before doing anything else, click the Field: Add button to open the column editor and add additional fields as is done in fig:gis:add_new_fields.
Once done, points can then be added and changed as shown in fig:gis:edit_attributes.
Here it is important to click both Apply in the Attributes window and click the Save button in the Edit panel after everything has been input.
Otherwise you may risk losing all your newly added data points! :(
Georeference image/raster#
Import an image you want to georeference in the map in JPG or PNG format. Then go to Imagery > Georeference > Add control points. Click an exact point on the image and then click this point in the map before saving the changes.
Connecting to ArcGIS Servers#
Insert > Connections > Add ArcGIS Server
NPI server#
While Npolar provides a very useful service through toposvalbard and svalbardkartet, these have limited abilities for interacting with the data. As such, it may be wise to import the toposvalbard data straight into ArcGIS by going to the Insert tab and click on the Connections icon.
Then select New ArcGIS Server, and fill out the Server URL as below:
https://geodata.npolar.no/arcgis/rest/services/
Once connected, drag over the NP_Basiskart_Svalbard_WMTS_32633 onto your map.
Svalbox server#
Although you could probably manually check the svalbox webpage and check which outcrops are closest, easier ways exist. Let’s proceed by connecting directly to the Svalbox ArcGIS server. Go to the Connections icon. Then select New ArcGIS Server, and fill out the Server URL as below:
http://svalbox.unis.no/arcgis/rest/services/
Then you should be able to find the Svalbox data in the Catalog panel, and you can drag and drop different data sets straight into your map.
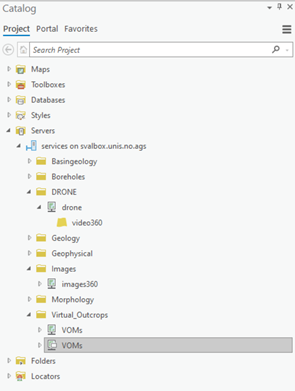
Harvesting metadata: the 360image to iframe example#
Once the Svalbox ArcGIS server has been added to your project, drag and drop the images360 layer into your map. The location of 360 images should now be visible on your map. However, when clicking on them, you will not be shown the 360 image in the way it is served to you on www.svalbox.no/map. Instead, a popup featuring all the image’s metadata will show up. Here, the most important is to copy the svalbox_i0wpurl link - this link can be pasted into the Pannellum panorama url link box to generate a 360 view of the image.
Configure Pop-ups#
Display Sketchfab models#
Right click dom layer in map panel > Configure pop-ups
Select Text icon > Enable HTML > Paste the text below into new text layer.
<div class="sketchfab-embed-wrapper"> <iframe src="https://sketchfab.com/models/{publ_sketchfab_id}/embed"> </iframe> </div>
Display Pannellum photospheres#
Right click photospheres layer in map panel > Configure pop-ups
Select Text icon > Enable HTML > Paste the text below into new text layer.
<iframe width="600" height="400" style="border-style:none;" src="https://cdn.pannellum.org/2.5/pannellum.htm#panorama={api_link}"></iframe>
Remove orther pop-up fields
Ensure that you remove any additional fields present in the pop-up pane.
Edit layer characteristics#
Depending on the layer characteristics that we want to modify we will go to:
Appearance tab
Symbology: Right click on the feature layer in the Control Pane > Symbology
Exporting a map#
Insert tab > New Layout > Generate the frame you want for your map.
Map > Activate Map Frame to move and edit the map. Add Legend, North Arrow and Scale bar.
Export map: Share > Export Layout. Export Raster in -PNG and Vectors in -EPS. It is important to select Clip to Graphics Extent.