
Geomodeling tutorial#
Interpretation of the digital model#
Work in progress
Interpretation of the digital model can be done through different means. Thusfar, the tutorial only details the use of the Metashape GUI. Feel free to contribute with a different programme workflow.
Metashape#
Annotations: points, polylines, polygons#
Point clouds, meshes and tiled models can all be interpreted directly from within the Metashape GUI. Fig. 52 shows the annotation drop-down menu, in which both the annotation type (e.g., points) and mechanism can be selected (e.g., snap to grid).
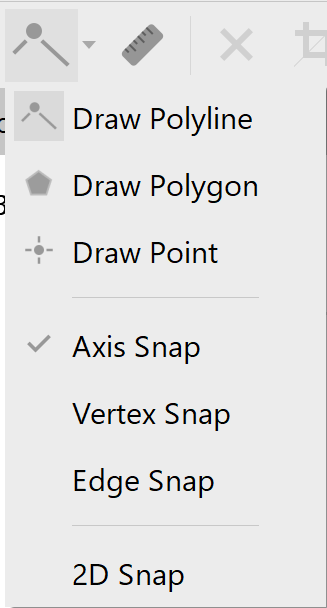
Fig. 52 Various annotation options can be selected, including polylines, polygons and points (combined referred to as shapes).#
Once the annotation type and mechanism are set, the model can be annotated by clicking in the desired locations. For points, a left-mouse single click results in the creation of a point. Polylines and polygons require clicking along the feature until the end is reached, which corresponds to a double-click with the left-mouse button. In all cases, termination of the annotation exercise results in a property window. Here the label of the shape can be changed, the description set, and new shape groups and properties created or revised.
Fig. 53 Polyline annotation of a fracture in a digital outcrop model. Similar operations allow one to annotate the model with points and polygons.#
Subsequently - as long as the polyline or polygon is selected - one can add additional vertices to the annotation by clicking i on the keyboard, or r to remove them. The same can also be achieved through the right-click pop-up window, which furthermore gives access to the same property window by selecting Properties.
Fig. 54 Polyline interaction options. Use right-click on a selected shape to open the pop-up menu. Similar operations allow one to interact with points and polygons.#
Ruler tool#
While distances could easily be calculated from the different points in a shape, the ruler tool provides an easier way of doing so. Simply activate the tool and left-click the points of interest to return a distance.
Fig. 55 Measuring distances within a digital model. Don’t believe the given value is right? Or would you like to verify that your model is indeed to scale? Measure the real-world dimensions (e.g., height of a hand-sized sample) and their digital counterparts and compare.#
Strange distance values or coordinates?
It could be that your model has not been properly constrained with a coordinate system or CRS (e.g., from photos with GPS metadata, GCPs). Having a valid CRS set for your Metashape project not only allows your model to be exported with real-world coordinates, it also gives meaning to the values given onscreen. Remember the SketchFab Labs distance feature discussed in Session 4? If you look closely you will notice that only numbers are given without units. SketchFab is an example of a service that does not use a CRS. One therefore has to guess what the original CRS of the uploaded model is to make sense of the SketchFab Labs distances.
When the model has been annotated, one can simply export the (georeferenced) annotations by selecting File/Export/Export Shapes…. First a dialog will prompt a save location and savefile type. The shapefile format, though old and a pain to work with, is a well-known standard and can be opened in most GIS-capable software solutions (including Petrel). Once specified, the shapes export dialog allows for a selection of which shapes to export; whether to only export their points, polylines, and/or polygons, and which CRS the exported file should use. Make sure to always enable the Shape labels and Shape attributes for exporting.
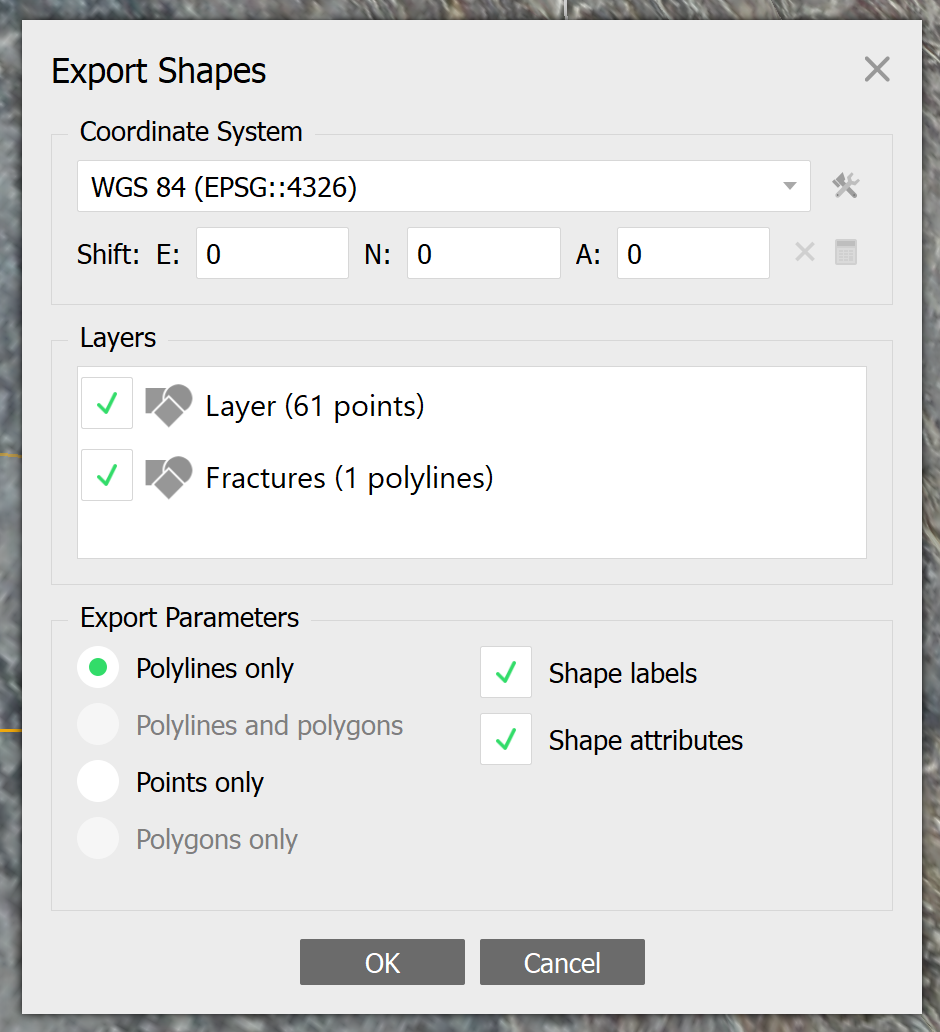
Fig. 56 The dialog for exporting shapes. Always enable Shape labels and Shape attributes.#
Interpolation versus reality: interpretation
As one may notice, lines between points in the polyline and polygon shapes are simply interpolated. That means that to accurately interpret a given section, additional points (vertices) should be added along the entire feature to accurately depict one’s interpretation. One should therefore always treat the polyline and polygon “lines” as a visualisation aid, and definitely not as the interpretation itself (i.e., the interpretation are only the points within the shapes).